Research: Shallow Water Habitat Mapping
-
Benthic Habitat Mapping Overview
-
Spatial Data
Available Datasets by Region (with links to download data)
-
Benthic Mapping Techniques
Acoustics—Side-scan sonar, echosounder
-
Verifying and Interpreting Side-Scan Sonar Data
-
Spatial analysis
-
Current Projects
1. Benthic Habitat Mapping Overview
Benthic can be defined as anything associated with or happening on the bottom of a body of water. Organisms living on the bottom of a body of water are referred to as benthos. Habitat is broadly defined as the physical location or type of environment in which an organism or biological population lives or occurs and benthic habitat are those habitats in relation to the bottom. At CCRM, we focus on the characterization of shallow benthic habitat (< 4 m depth), which in the Chesapeake Bay include many critical structural habitats such as seagrass beds, shellfish beds and sandflats.
2. Spatial Data [top]
CCRM develops benthic habitat data for nearshore estuarine environments in the Chesapeake Bay. These data can be utilized in a myriad of ways including:
1) Examination of distributions of habitat in relation to biological communities,
2) Location and evaluation of essential spawning and nursery habitat, and
3) Quantification and removal of potentially harmful marine debris.
Available Datasets by Region
Piankatank River (coming soon)
Data for the Piankatank include submerged aquatic vegetation (SAV) distributions derived from aerial photography, SAV distributions derived from sidescan sonar imagery, and sediment data derived from grab sampling. These data sets are provided in shapefile format. Data coverage includes the nearshore reaches of approximately 47 kilometers of the estuary from the mouth of the river at Fishing Bay upriver to Freeport.
Mobjack Bay
Data for the Mobjack Bay include submerged aquatic vegetation (SAV) distributions derived from aerial photography, benthic characterization (SAV, oyster reef and broad sediment class distributions) completed with side-scan sonar technology (Sea Scan Marine Sonics, 600 kHz) and an echo-sounder (Knudsen 320 BP; Kel 28/200 kHz dual-frequency transducer), and data derived from verification activities including sediment samples and video imagery. These data sets are provided in shapefile formats and delineated by river: Severn River, East River, North River, and Ware River.
Upper James River (coming soon)
Data for the Upper James River include benthic characterization (broad sediment class distributions, gravel beds) completed with side-scan sonar technology (Sea Scan Marine Sonics, 600 kHz) to assess the availability of Atlantic sturgeon spawning habitat.
3. Benthic Mapping Techniques [top]
Acoustics—Side-scan Sonar, single-beam
Multiple technologies can be used for benthic characterization depending on project goals and targeted habitats. At CCRM, we have utilized side-scan sonar technology (Sea Scan Marine Sonics, 600 kHz) and an echo-sounder (Knudsen 320 BP; Kel 28/200 kHz dual-frequency transducer). We primarily target nearshore shallow-water zones (< 4 m depth) and have modified our methodology to effectively characterize those environs.
4. Verifying and Interpreting Side-Scan Sonar Data [top]
Direct benthic sampling (using grabs or cores), bottom photography and videography, and auxiliary remotely sensed data (e.g. submerged aquatic vegetation distribution based on aerial photography) are useful verification tools. Throughout our efforts at benthic mapping, we have utilized a combination of these methods.
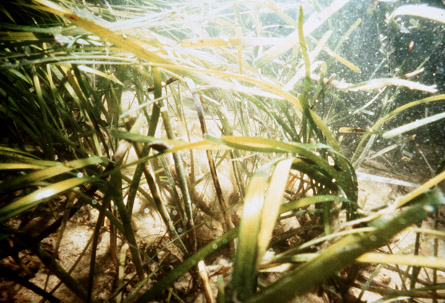
Most recently, we obtained benthic imagery with a modified benthic sled outfitted with a forward and downward-facing video camera (Aqua-vu), that is flown along transects at each site of a given acoustic class (Figure 3—see below). Sediment-probes are conducted along the same transect with a handheld PVC rod with an adaptive clear piece at the end for sampling the top (~10-17 centimeters) of sediment depending on the sediment type/penetration. For each sediment probe, images are recorded of the sample (Figure 4-see below), estimated depth of sediment layers within the probe noted, and descriptions of sediment type by percent and biogenic materials (e.g. shell, root matter) in the top and bottom layers of the sediment plug recorded independently. Information on demarcations in sediment layers is critical to relate to dual-frequency echo-sounder data which describes sediment at differing depths of penetration (i.e. 28 kHz generally penetrates deeper into the sediment than 200 kHz which describes more surficial conditions). Sites beyond the reach of the sediment probe (in excess of 3.5m), or with impenetrable conditions are assessed by physically sampling surficial sediments when necessary.
 |
Figure 3. Video imagery of submerged aquatic vegetation benthic habitat in the Mobjack Bay
|
 |
Figure 4. Sediment probe to ascertain sediment type, presence of biogenic materials and depth of individual sediment layers. |
5. Spatial analysis [top]
Post-processing of acoustic images with QTC SIDEVIEWand QTC IMPACT
Image-based seabed classification is the organization of bottom types (seabeds, lake beds, river beds) into discrete units based on a characteristic acoustic response. Seabed classification can be completed in a variety of ways, including with manual inspection of raw images and automated classification software. Automated classification characterizes acoustic diversity not the physical properties of the seabed; therefore, ground-truthing to determine precise associations of acoustic signals with benthic habitat is essential.
QTC SIDEVIEW (used with side-scan sonar imagery) and QTC IMPACT (used with echo-sounder data) are integrated software packages developed by Quester TangentTM that classify sediments using the statistical properties of backscatter images. These packages include tools to perform quality assurance, analysis and classification. The processing steps outlined below include compensation of raw images, generation of continuous rectangles to overlay on images, generation and clustering of image descriptions, and selection and mapping of optimal acoustic signal classes

Data processing steps and decision branches for classification of acoustic sonar images in QTC SIDEVIEW and CLAMS. Similar procedures apply for QTC IMPACT when processing echo-sounder data.
6. Current Projects [top]
Surveying and summarizing the spatial arrangement of benthic habitat types within the nearshore of Mobjack Bay, Virginia
Principle Investigators: Donna Marie Bilkovic and Carl H. Hershner
Funding Agency: NOAA/NCBO
Interim Report
OBJECTIVES:
Mobjack Bay and its associated tributaries historically contained a diverse array of critical habitat types including oyster reefs, seagrass beds and tidal wetlands. Currently, multiple restoration efforts are underway throughout this watershed to mitigate losses from disease, and habitat destruction and modification. Benthic habitat will be mapped and quantified within the nearshore of Mobjack Bay, including the Severn, Ware, North and East Rivers, and compared with described aquatic habitat distribution (e.g. SAV, tidal marsh) from other sources (CCRM, wetlands program and VIMS SAV program), to characterize the extent and distribution of habitats.
Acoustic Surveys
Testing and calibration of equipment was completed prior to survey work to ensure the accuracy of data collected. Survey tracks were plotted based on the results of pilot surveys, which helped establish the most appropriate settings and protocols for the shallow-water habitat mapping of Mobjack Bay (Figure 1).
All benthic habitats between 1 and 4 meter depths were surveyed in four tributaries of the Mobjack Bay (Severn, Ware, North, East rivers) during May through July 2007 with multiple acoustic technologies. Benthic characterization was completed with side-scan sonar technology (Sea Scan Marine Sonics, 600 kHz) and an echo-sounder (Knudsen 320 BP; Kel 28/200 kHz dual-frequency transducer).
Side-scan sonar surveys covered a distance of 50 m on either side of the nadir for a total width of 100 m. Where there was an extensive broad reaches of shallow waters, multiple passes were completed to ensure all benthic habitats between 1 and 4 meters were scanned. These passes had a 20 percent (20m) overlap in the image for complete coverage. Our track line encompassed 158.3 km, with a total swath area of 12.69 km2. The breakdown for each river is as follows:
River |
Area Surveyed |
Severn River (with Four Points Marsh) |
6.33 km2 |
Ware River |
2.96 km2 |
North River |
2.28 km2 |
East River |
1.12 km2 |
Figure 1. Acoustic survey tracklines completed in the Mobjack Bay: Severn, Ware, North and East Rivers.
Post-processing of Acoustic Data
Survey data were analyzed with Questar Tangent software (July-August 2007) for the entire area. The echo-sounder single beam data were processed with QTC Impact, and the side-scan sonar data with QTC Sideview. The complementary acoustic datasets and associated post-processing output were used in conjunction with field observations to select five primary acoustic classes to represent benthic habitat types (Figure 2).
Figure 2. Benthic characterization of the Mobjack Bay based on side-scan sonar classification by QTC Sideview. Each color represents a unique acoustic class, which may be representative of unique surficial benthic habitat. In this image, similar colors have similar acoustic signals and thus may have similar benthic habitat characters.
Validation of Acoustic Classification
Acoustic classes were stratified by river and three regions were randomly selected for each class in each stratum (river) for ground-truthing. Field evaluation is currently underway and consists of two major elements: underwater video imagery and sediment type assessments.
Benthic imagery was obtained with a modified benthic sled outfitted with a forward and downward-facing video camera (Aqua-vu), that is flown along transects at each site of a given acoustic class (Figure 3). Sediment-probes are conducted along the same transect with a handheld PVC rod with an adaptive clear piece at the end for sampling the top (~10-17 centimeters) of sediment depending on the sediment type/penetration. For each sediment probe, images are recorded of the sample (Figure 4), estimated depth of sediment layers within the probe noted, and descriptions of sediment type by percent and biogenic materials (e.g. shell, root matter) in the top and bottom layers of the sediment plug recorded independently. Information on demarcations in sediment layers is critical to relate to dual-frequency echo-sounder data which describes sediment at differing depths of penetration (i.e. 28 kHz generally penetrates deeper into the sediment than 200 kHz which describes more surficial conditions). Sites beyond the reach of the sediment probe (in excess of 3.5m), or with impenetrable conditions are assessed by physically sampling surficial sediments when necessary.
|
Figure 3. Video imagery of submerged aquatic vegetation benthic habitat in the Mobjack Bay
|
|
Figure 4. Sediment probe to ascertain sediment type, presence of biogenic materials and depth of individual sediment layers. |
NEXT STEPS:
We will complete field ground-truthing of acoustic classes, and further validation with auxiliary datasets, such as submerged aquatic vegetation surveys. We will then examine and summarize underwater imagery in relation to the ground-truth data compiled, and will associate acoustic classes with the appropriate benthic characterization. Lastly, we will estimate the amount of each benthic class and create geo-referenced inventories and maps for use in management and restoration activities.
Survey of potential Atlantic sturgeon spawning habitat in the James and Appomattox rivers
The Atlantic sturgeon is an anadromous fish that migrate from the ocean into coastal estuaries and rivers to spawn. In the Chesapeake Bay, Atlantic sturgeon historically spawned in all the major tributaries of the Bay. Presently, spawning populations have been drastically reduced due to overfishing, pollution, dam construction and habitat degradation. Vital to the restoration of Atlantic sturgeon populations in Virginia, is an understanding of the quantity and quality of available suitable spawning and nursery habitat. Low sturgeon population levels have hindered the location of viable spawning reaches through direct observation of habitat use within Virginia’s major tributaries, James, York, and Rappahannock. However, anecdotal evidence and the capture of early juveniles have indicated the possibility of successful spawning occurring in the James and York Rivers.
Several habitat parameters are hypothesized to be essential for viable spawning, including salinity (salt front to the fall line), hydrodynamic complexity (e.g. eddies with fast moving flowing reaches), high dissolved oxygen (>4mg/L), and proper spawning substrate to facilitate adhesion of eggs. In fact, the presence of hard bottom substrate, typically bare or thinly sedimented hard bottom covered with gravel or cobble, is a critical characteristic of spawning habitat (Bushnoe et al. 2005). The location of reaches of hard bottom benthic habitat which is a limiting factor for successful spawning will enhance Atlantic sturgeon restoration efforts
Project Objectives
To assess the availability of suitable spawning habitat in the James River for Atlantic sturgeon, benthic habitat characterization within the known range of historic spawning reaches will be completed based on side-scan sonar imagery that has been processed with specially designed classification software, SideView developed by Questar Tangent Corporation. The location of viable hard bottom habitats for sturgeon spawning will be determined and geo-referenced for future evaluation with additional habitat quality information.
Methods
Previously acquired side-scan sonar imagery of the upper James River from Turkey Point to Rockett’s will be processed and classified into similar acoustic signal categories. This imagery was acquired with a high-resolution remote sensing system (Marine Sonics 600 KHz side scan transducer) for habitat characterization by delineating benthic surface sediment types (e.g. gravel, sand), and physical structure (e.g. shellfish beds, woody debris, bedrock). The side-scan sonar has the ability to map swath transects (in this case 50m swaths) of benthic habitat, and was towed to collect real-time, geo-referenced, riverbed mosaic data with overlapping edges matched to form a continuous profile of the bottom. This equipment provided high-resolution digital images of the surface structure of the benthic environment. The acoustic signal of bottom will be categorized with the classification software QTC SideView, and geo-referenced profiles can then be converted to GIS coverages for the depiction of areas of classified habitats.
Once the imagery is classified, select habitat areas of interest will be resurveyed with side-scan sonar using a finer resolution scale (20 m swaths) and echosounder (Knudsen 320 BP; Kel 28/200 kHz dual-frequency transducer) technology to ground-truth acoustic categories. The Knudsen dual-frequency transducer, in conjunction with QTC impact software for post-processing, allows for the interpretation of sediment classes near the benthic surface (200 kHz), as well as penetrates and defines sediment type at depth (28 kHz). This additional data will aid in the determination of the presence or absence of a fine-silt sediment layer over viable hard-bottom spawning habitat. Additional ground-truthing methods will be applied where possible, including Underwater Viewing Systems and sediment sampling.
Time Frame: 2007-2008

Scanned area within the box and two potential secondary spawning reaches circled for future assessment. |